


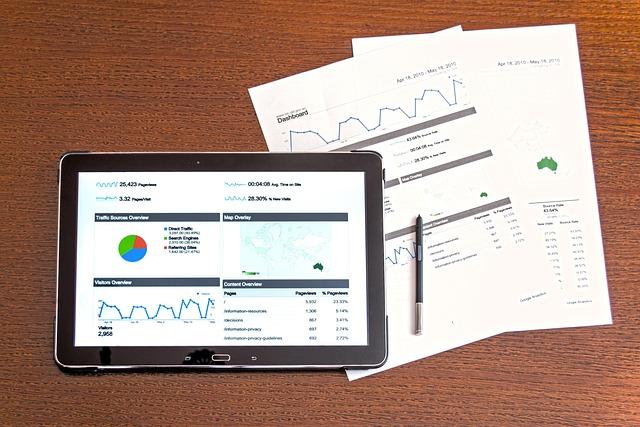
The City of Dallas has unveiled a groundbreaking Crime Analytics Dashboard designed to enhance public safety through increased transparency and data-driven insights. This new online tool provides residents, law enforcement, and policymakers with real-time access to crime statistics and patterns across the city. By leveraging advanced analytics, the dashboard aims to support proactive measures in crime prevention and foster a stronger connection between the community and local authorities. The launch marks a significant step in Dallas’s ongoing efforts to utilize technology in addressing public safety challenges.
Dallas Introduces Advanced Crime Analytics Dashboard to Enhance Public Safety
Dallas is stepping up its public safety efforts with a cutting-edge crime analytics dashboard designed to provide real-time insights into crime patterns across the city. This innovative tool integrates data from multiple sources, including police reports, emergency calls, and community feedback, enabling law enforcement agencies to respond more proactively. By harnessing the power of advanced analytics, officials aim to identify trends, allocate resources more efficiently, and ultimately reduce crime rates in neighborhoods most at risk.
Key features of the dashboard include:
- Interactive maps displaying hotspots and temporal crime trends
- Predictive modeling capabilities to anticipate potential criminal activity
- Customizable alerts for residents and officers based on location and crime type
These enhancements are expected to foster stronger community collaboration and transparency. Below is a brief overview of performance metrics from the pilot phase, showcasing the dashboard’s impact on response times and crime prevention:
| Metric | Before Implementation | After Implementation |
|---|---|---|
| Average Police Response Time | 8.4 minutes | 6.2 minutes |
| Crime Rate in Pilot Zones | 15.7 incidents per 1,000 residents | 12.1 incidents per 1,000 residents |
| Community Reports Submitted | 350 per month | 680 per month |
Detailed Insights Reveal Crime Patterns and Hotspots Across the City
Dallas’ new crime analytics dashboard provides unprecedented transparency by mapping out crime trends with pinpoint accuracy. Utilizing data from law enforcement agencies, the tool identifies recurring patterns and dangerous hotspots, allowing both officials and residents to stay informed. Key areas of concern are prominently displayed, highlighting neighborhoods where theft, burglary, and violent incidents have notably increased over the past six months. This granular insight enables targeted resource allocation, ensuring patrols and prevention efforts are concentrated where they are needed most.
The dashboard also breaks down incidents by time of day and type, revealing critical shifts in criminal activity. For example, property crimes tend to surge during late evenings, while violent offenses peak in early mornings. The following table offers a snapshot of recent statistics:
| Crime Type | Peak Time | Hotspot District |
|---|---|---|
| Burglary | 9 PM – 12 AM | Downtown East |
| Assault | 4 AM – 7 AM | Southside |
| Vehicle Theft | 10 PM – 2 AM | North Park |
This actionable data is revolutionizing how Dallas partners with its communities — empowering residents to take proactive safety measures and fostering collaboration with law enforcement to reduce crime citywide.
- Real-time updates keep the public informed as crime trends evolve.
- User-friendly maps highlight high-risk zones visually.
- Custom filters allow users to track specific crime types or time periods.
How Real-Time Data Will Empower Law Enforcement and Community Engagement
With the introduction of the new crime analytics dashboard, law enforcement officers in Dallas gain unprecedented access to real-time data streams. This immediate flow of information allows for faster decision-making and more proactive crime prevention strategies. Patrol units can now respond quicker to incidents, while analysts identify emerging crime patterns as they develop. Beyond immediate response, the dashboard facilitates resource allocation by highlighting hotspots, ensuring that police presence is optimized where it’s needed most.
Community engagement also stands to benefit significantly. Residents will have access to up-to-date crime statistics through a user-friendly interface, fostering transparency and trust between citizens and law enforcement. By empowering the public with information, the initiative encourages collaboration in neighborhood watch programs and local safety efforts. Key benefits include:
- Enhanced communication channels between police and community members
- Improved awareness of local crime trends and safety alerts
- Opportunities for feedback that help shape policing priorities
| Feature | Impact |
|---|---|
| Interactive Heat Maps | Visualize crime density in real time |
| Mobile Alerts | Instant notifications for residents |
| Trend Analysis | Identify rising concerns before escalation |
Recommendations for Residents on Using the Dashboard to Stay Informed and Vigilant
Residents are encouraged to actively engage with the dashboard by regularly reviewing updated crime data from their neighborhoods. Familiarizing yourself with patterns in reported incidents can empower you to take proactive measures, such as improving home security or participating in community watch programs. Utilizing the dashboard’s filtering options to hone in on specific types of crimes or geographic zones can provide focused insights that better inform daily routines and neighborhood safety discussions.
To maximize the benefits of this new tool, consider these best practices:
- Set personal alerts: Subscribe to notifications for incidents occurring near your home or workplace to stay instantly informed.
- Share insights: Use dashboard data to engage with local law enforcement and community groups, fostering collaborative efforts to reduce crime.
- Verify information: Cross-check alerts with official city announcements to avoid misinformation.
- Report suspicious activity: When trends show a rise in specific crimes, increase vigilance and promptly report anything unusual.
| Dashboard Feature | Resident Action | Suggested Frequency |
|---|---|---|
| Crime Heat Maps | Identify high-risk areas | Weekly |
| Incident Timeline | Track recent crime spikes | Daily |
| Neighborhood Comparison | Benchmark safety levels | Monthly |
Insights and Conclusions
As the City of Dallas rolls out its new Crime Analytics Dashboard, residents and officials alike gain a powerful tool for transparency and proactive community safety. By providing real-time access to crime data, the city aims to foster informed public engagement and enhance strategic law enforcement efforts. This initiative marks a significant step forward in leveraging technology to address urban challenges, underscoring Dallas’s commitment to innovation and public safety. Stay tuned to Dallas City News for ongoing updates on the dashboard’s impact and future enhancements.