



Decoding the Debate: Understanding Crime Rate Trends in the United States
Conflicting Perspectives Fuel Public Discourse on Crime Trends
Recent discussions surrounding crime rates in the U.S. have become increasingly polarized, with policymakers, law enforcement, and community advocates presenting contrasting viewpoints. Some highlight alarming increases in violent offenses such as armed carjackings and street robberies in major metropolitan areas, interpreting these as signs of a worsening public safety crisis. Conversely, others emphasize that these incidents are often concentrated in specific locales and do not reflect a nationwide surge, pointing instead to data indicating either stable or declining crime rates overall. This divergence has sparked a broader debate about the accuracy of crime statistics, the impact of media narratives, and the methodologies used in crime reporting.
To better understand these opposing claims, it is helpful to examine recent crime data trends:
| Crime Category | Year-over-Year Change (%) | Viewpoint Supporting Increase | Viewpoint Supporting Stability |
|---|---|---|---|
| Violent Crime | +7% | Indicates escalating public safety risks. | Rise is localized, not reflective of national trend. |
| Property Crime | -4% | Represents significant progress often ignored. | Decline supports argument for overall crime stability. |
| Homicide Rates | +2% | Highlights need for enhanced law enforcement. | Variations fall within expected statistical fluctuations. |
As this conversation unfolds, it is crucial for communities to critically evaluate both anecdotal evidence and comprehensive crime statistics. A nuanced understanding of the data helps move discussions beyond fear or complacency toward informed decision-making.
Dissecting Crime Data: Why Statistics Tell Different Stories
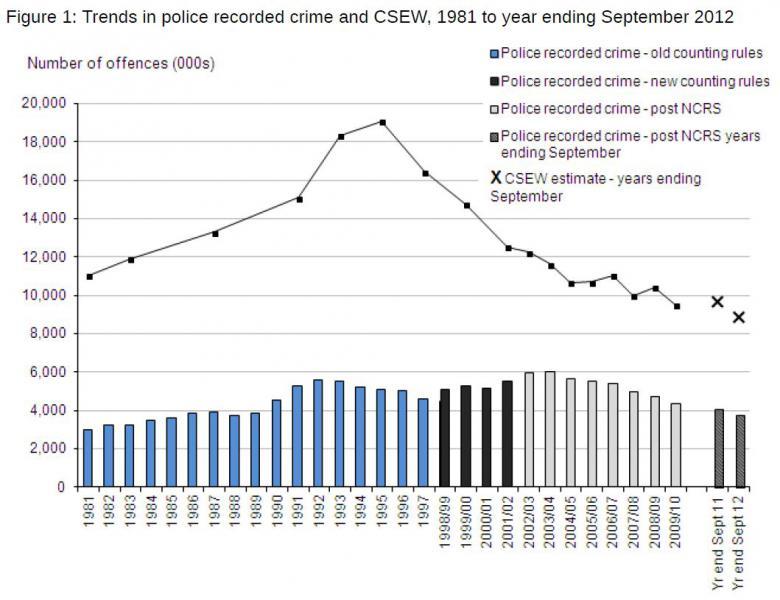
Variations in crime statistics often arise from differences in data collection methods and reporting standards, complicating the interpretation of trends. Law enforcement agencies may apply distinct definitions to criminal acts or alter reporting procedures over time, which can skew year-to-year comparisons. For example, some crime data sets rely solely on police reports, while others incorporate victimization surveys or hospital records, each capturing different facets of criminal activity. This patchwork of sources leads to conflicting narratives, underscoring the importance of examining the context behind the numbers.
When analyzing recent crime data, several critical factors must be taken into account:
- Geographical scope, including urban versus rural distinctions
- Categories of crime measured, such as violent, property, or cybercrime
- Modifications in law enforcement reporting protocols
- Time periods and methods used for data aggregation
| Data Source | Crime Type | Reported Change | Data Collection Method |
|---|---|---|---|
| Agency X | Violent Crime | +5% | Official Police Reports |
| Agency Y | Violent Crime | -3% | Victimization Surveys |
| Agency X | Property Crime | -10% | Official Police Reports |
| Agency Y | Property Crime | -8% | Victimization Surveys |
By cross-examining these diverse data sources and methodologies, analysts can better grasp why crime trend reports often conflict. A holistic approach that acknowledges the limitations and advantages of each dataset is essential for an accurate portrayal of public safety.
Insights from Experts on Data Collection and Reporting Biases
Criminologists and data analysts emphasize that interpreting crime trends demands careful consideration of the data collection techniques employed. Different agencies utilize various sources—ranging from police records and victim surveys to self-reported information—each susceptible to unique biases that can distort findings. Experts stress the importance of contextualizing data, noting that factors such as changes in reporting behavior, law enforcement policies, and societal attitudes significantly impact crime statistics.
Prominent concerns highlighted by specialists include:
- Underreporting: Victims may choose not to report crimes due to fear, stigma, or mistrust, leading to gaps in official data.
- Inconsistent Definitions: Variability in how crimes are classified across jurisdictions can cause discrepancies in reported figures.
- Data Collection Changes: Alterations in survey methods or reporting standards over time can create misleading trends.
| Organization | Data Source | Potential Bias |
|---|---|---|
| Federal Bureau of Investigation (FBI) | Police Reports | Underreporting due to unreported crimes |
| Bureau of Justice Statistics (BJS) | Victim Surveys | Recall bias and selective participation |
| Centers for Disease Control and Prevention (CDC) | Self-Reported Data | Social desirability bias |
These complexities underscore the need for transparency in crime data methodologies and caution against oversimplified interpretations that can exacerbate public misunderstanding. Experts advocate for responsible communication by media and policymakers to ensure statistics are presented with appropriate context.
Strategies for Enhancing Crime Data Reporting and Policy Formulation
To improve public comprehension of crime trends, it is imperative that media outlets and decision-makers adopt transparent and contextualized reporting practices. This involves differentiating between raw crime counts and rates adjusted for population changes, as well as steering clear of sensationalist language that may distort public perception. Utilizing authoritative sources such as the FBI’s Uniform Crime Reporting (UCR) program and the Bureau of Justice Statistics enhances credibility. Additionally, clarifying the timeframes and considering socio-economic influences on crime rates ensures a more comprehensive narrative.
Recommended best practices include:
- Standardizing timeframes and geographic parameters to avoid misleading comparisons.
- Publishing detailed explanatory notes alongside statistical releases.
- Collaborating with data experts to interpret trends objectively and minimize partisan bias.
| Focus Area | Recommended Action | Anticipated Benefit |
|---|---|---|
| Data Visualization | Present per capita rates alongside absolute numbers | Improved understanding of crime relative to population size |
| Contextual Reporting | Integrate socioeconomic and demographic factors | More informed policy discussions and targeted interventions |
| Communication Style | Adopt neutral language, avoid alarmist headlines | Reduced public anxiety and misinformation |
Final Thoughts
The ongoing debate over crime statistics continues to evoke strong opinions, but a careful examination of the data reveals a more complex reality. FactCheck.org’s detailed review highlights the importance of grounding discussions in verified evidence rather than anecdote or sensationalism. By appreciating the intricacies behind crime data, both policymakers and the public can engage in more thoughtful dialogue and develop strategies that effectively address community safety challenges.